
It’s Friday, February 20 and we are in the depths of the bear market of 2009 in the US. Here at Global Finance Net Blog, that means it is time to publish our Dow Charts once again. You can read our earlier post on Dow charts for some explanation of the charts as well as links on the difference between logarithmic charts and arithmetic charts. We also did a post earlier today on the Dow 30 components and their weightings (a little insight on how the modern day Dow is calculated).
Without much more text, follow the jump below for the Dow charts to close out this otherwise bad week on the markets…
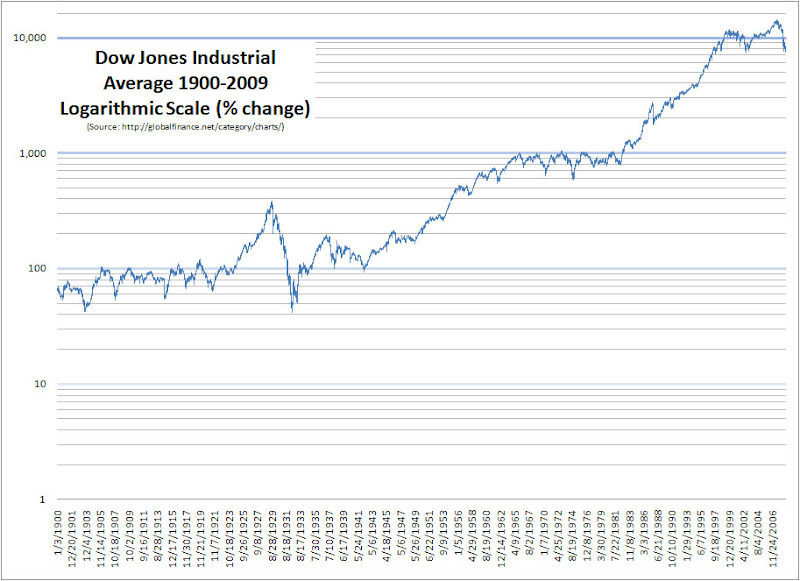
The first chart is one we like to show to keep things in perspective. It is the chart going back to 1900. We’ve updated it to today and we can see some drop-off at the end as the correction of 2009 takes hold:
The next chart is from 1997 to 2009. This is relevant as the market broke through lows today not seen since 1997. We can see the correction on the chart below:
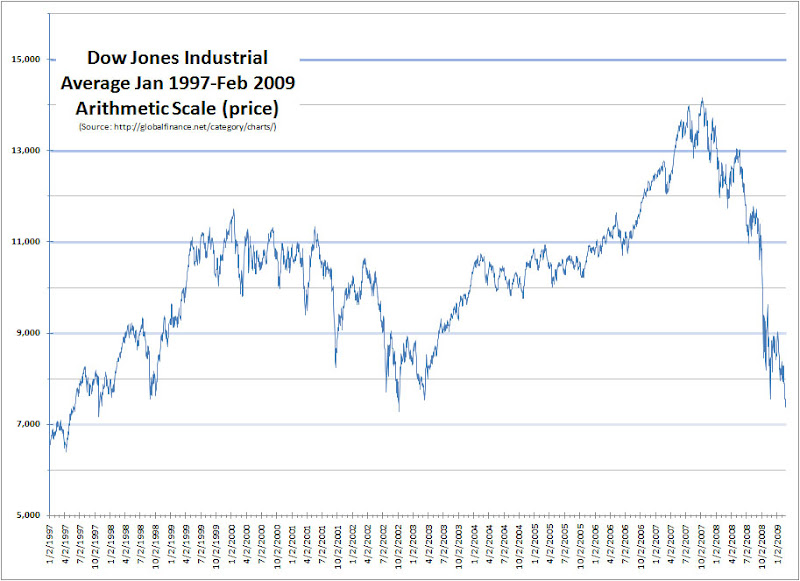
Keep in mind that the 1997-2009 chart is an arithmetic chart, not a logarithmic chart so there is some distortion in the price movements. But, for illustrative purposes it makes the point that we are back where we were 12 years ago.
. . . And that’s how it goes

