
It was a rough week for Obama’s economic people. In the competition for Presidential success, at least as judged by the markets, Obama is collapsing. Now, it is still too early to tell if this is just a short-term performance decline (like FDR) or a long-term slump.
Major media notices the decline
The attacks on Obama’s Dow Jones average started in earnest from conservative blogger Michelle Malkin attributed Obama’s Dow performance back to November 2008 making this week a “2000 point tumble”.
While it wasn’t a criticism of the Administration’s stock market average, CNBC host Rick Santelli led a self-proclaimed “revolt” against the Obama housing plan from the floor of the Chicago Board of Trade. A clip of Santelli’s revolt can be seen on CNBC or YouTube.
(Chart comparing the Dow under Obama, FDR, Reagan and Clinton after the jump…)
But is it that bad, yet?
The Obama Dow Jones slide has not become a collapse, yet. Relative to other Presidents, Obama is still within 10% of initial performance. Also, we have not been through the first year, so unless Obama clearly puts the market on a downward trajectory with no hope for a rebound in sight, it is not certain that he will be any worse than Reagan’s first year (a market performance of worse than 11%).
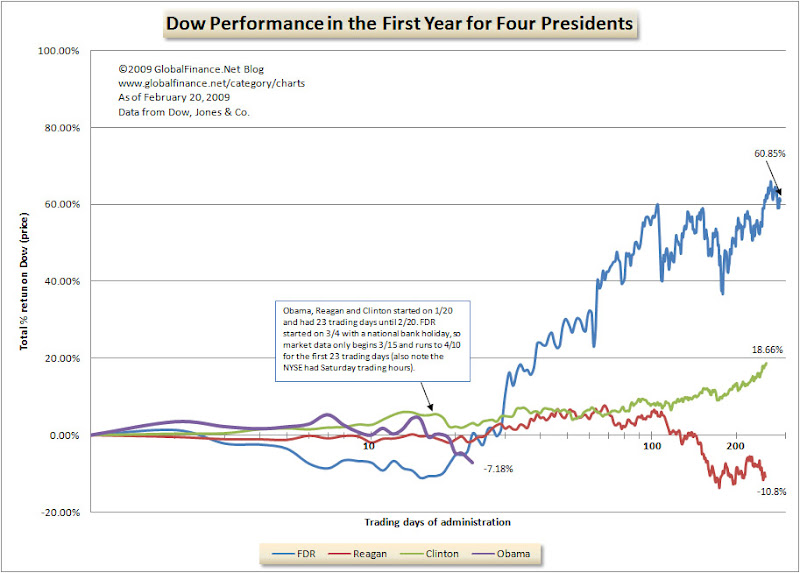
But, there are always two sides to every trade, so it can always get worse. To show the increasing bearishness of Obama’s Dow performance, here is the updated chart of the Four Presidents (Obama, FDR, Reagan and Clinton) Dow Performance in their first year in office:
. . . And that’s how it goes

