A sample text widget
Etiam pulvinar consectetur dolor sed malesuada. Ut convallis
euismod dolor nec pretium. Nunc ut tristique massa.
Nam sodales mi vitae dolor ullamcorper et vulputate enim accumsan.
Morbi orci magna, tincidunt vitae molestie nec, molestie at mi. Nulla nulla lorem,
suscipit in posuere in, interdum non magna.
|
By Ken, on February 20th, 2009 It was a rough week for Obama’s economic people. In the competition for Presidential success, at least as judged by the markets, Obama is collapsing. Now, it is still too early to tell if this is just a short-term performance decline (like FDR) or a long-term slump.
Major media notices the decline
The attacks on Obama’s Dow Jones average started in earnest from conservative blogger Michelle Malkin attributed Obama’s Dow performance back to November 2008 making this week a “2000 point tumble”.
While it wasn’t a criticism of the Administration’s stock market average, CNBC host Rick Santelli led a self-proclaimed “revolt” against the Obama housing plan from the floor of the Chicago Board of Trade. A clip of Santelli’s revolt can be seen on CNBC or YouTube.
(Chart comparing the Dow under Obama, FDR, Reagan and Clinton after the jump…)
Continue reading “Obama’s Performance and the Dow” »
By Ken, on February 20th, 2009 It’s Friday, February 20 and we are in the depths of the bear market of 2009 in the US. Here at Global Finance Net Blog, that means it is time to publish our Dow Charts once again. You can read our earlier post on Dow charts for some explanation of the charts as well as links on the difference between logarithmic charts and arithmetic charts. We also did a post earlier today on the Dow 30 components and their weightings (a little insight on how the modern day Dow is calculated).
Without much more text, follow the jump below for the Dow charts to close out this otherwise bad week on the markets…
Continue reading “Dow Charts Updates 1900 and 1997 to 2009” »
By Ken, on February 20th, 2009
This is an interesting chart we have been meaning to put up on the site for some time. The chart tracks the price of oil (West Texas Intermediate) denominated in ounces of gold (price determined on the NY Commodities Exchanges). Our chart data reached back to 1900, so it is interesting to see the swings in the oil market without the noise from dollar exchange rate fluctuations.
(The charts and some analysis after the jump . . . )
Continue reading “Oil and Gold Chart 1900-2009” »
By Ken, on February 20th, 2009 There is a lot of chatter on the Internet about the US Government possibly taking over Citibank and/or Bank of America as early as this Friday evening. While we’re not here to speculate on the exact timing, the probability of a bank nationalization in the US within the coming months is very, very high. The rule of thumb I followed with the Bush 43 Administration was, whatever they say, it is three times worse. With President Obama (through no fault of his own) it is, whatever that say, it will come three times faster. So the rumored Fall 2009 nationalization may come three seasons earlier. . .
Effect on the DJIA
Both Citigroup and Bank of America are components of the Dow Jones Industrial Average (DJIA). The Dow is a price-weighted index comprised of 30 major corporate stocks (the term “industrial” is a bit of an anachronism). Based on the methodology Dow Jones & Company, Inc. uses to calculate the average, removing the two stocks would have little impact.
(More with a full Dow weighting table, Citibank, Bank of America and others after the jump . . . )
Continue reading “Bank Nationalization and the Dow” »
By Ken, on February 12th, 2009
Remember Iridium, the satellite phone that was supposed to bring global phone connectivity with a $10,000 handset for $10 per minute, provided you were calling from outdoors from an open location? It went bankrupt, taking $7 billion in investor capital with it.
To avoid the spectacle of de-orbiting, basically crashing and burning some 70-odd satellites in the atmosphere with unknown consequences (and wrecking a very expensive and good service for things like emergency response and military), the company was revived by private equity for a mere $25 million. The service still requires users to be in the line of sight of a satellite, but prices are lower, only $1-2 per minute for a phone call and it still works anywhere in the world, well almost anywhere until now . . .
It seems that yesterday gave us a small, albeit exciting preview of what that de-orbiting might have been like. An Iridium satellite crashed in to a non-functioning Russian satellite in low earth orbit. No service outages, injuries or any earth visible effects are reported. Iridium satellites are known for Iridium flares (reflections of the sun from their solar panels as they orbit), bit there are no fireworks from this incident. Perhaps an enterprising personal injury lawyer is on his or her way to Tempe, Arizona to pitch a lawsuit idea to the Iridium people as we speak?
. . . And that’s how it goes
By Ken, on February 11th, 2009
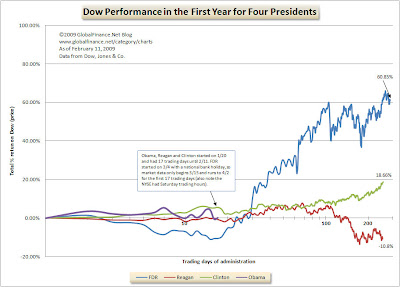
A lot has been made in the conservative press of President Obama’s reportedly “failed” administration. More noise has been made by progressives in a similar, though more helpful vein. Both sides point to Tuesday’s nearly 5% drop in the Dow Jones after Treasury Secretary Tim Geithner’s brief introduction to the bank rescue program. But after less than 20 trading days on the job, has Obama really failed to do the job? What about the track record of other Presidents who inherited difficult economic circumstances? Our chart for this week is a comparison of the Dow in the first year of the administrations of Franklin Delano Roosevelt (FDR), Ronald Reagan, Bill Clinton and the first 17 trading days of Barack Obama. You’ll be surprised to see who was really the market guru.
Four Presidents, four scenarios, four outcomes?
Of our selection of four Presidents (at least since the 1920s), only FDR and Obama inherited a grave economic crisis. Reagan inherited a growing set of economic problems that would increase later in his term, while Clinton inherited what those of us living through the current crisis would consider to be quite mild.
Here is how the Dow reacted for the first year in office for each president (the trading days are logarithmically compressed at the end so that the early trading days, where there is actually data for Obama, are easier to discern):
(More of the story below the jump . . . )
Continue reading “Dow Jones 30, Obama, FDR and History” »
By Muckraker, on February 10th, 2009
“All the news that fits, we print!”
This is the news summary from mainstream media sources (MSM), blogs, financial professionals and our analysis. We provide this to give you a short overview of what is happening in the world based on some of this blog’s themes (international finance, charts, markets, and so on). Please comment so we can improve our selection to make this section useful.
Global summary
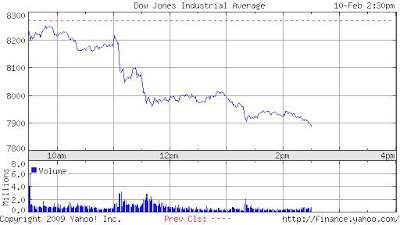
Markets delivered a Bronx cheer to Treasury Secretary Geithner’s bank bailout proposal. European markets closed before the speech, but here was the reaction in the US:
The Dow was off around 4.5% by 2:30pm EST. Leading the losses were financials with Citi (C) off 13% and Bank of America (BAC) off 18%. The London FTSE sold off just before its close (and just before the speech), it ended down 2.2%, Hong Kong closed even.
Oil continued its march down as well with crude futures at $38/bbl. This is probably in expectation of continued economic problems and dashed hopes of recovery.
(More news after the jump)
Continue reading “Global Finance Chatter: February 10, 2009” »
Page 2 of 6«12345...»Last »
|
|


